
Executive Summary
The concept of “AI debt” refers to the substantial financial commitments and risks associated with artificial intelligence development and implementation, particularly in startups and large corporations. According to Myrmikan Research’s August 14, 2026 report, the feasibility and value of AI debt are highly questionable due to several critical factors that merit detailed analysis.
The Current State of AI Investment
Market Valuations vs Reality
The AI market has experienced unprecedented valuations despite significant underlying challenges:
- AI Labs Valuation: The three major AI labs (OpenAI, Anthropic, and xAI) are valued at approximately $2.5 trillion
- Startup Funding: OpenAI raised $122 billion at an $822 billion valuation, while Anthropic raised $65 billion at a $965 billion valuation
- Hyperscaler Investments: Microsoft, Amazon, Google, and Oracle have announced over $2 trillion in firm, non-cancelable orders from AI providers
However, these valuations are based on unrealistic expectations:
- OpenAI had $13 billion in revenue but suffered $21 billion in operational losses
- Anthropic reportedly broke even operationally despite massive spending commitments
- The valuation of these companies is roughly forty times their revenue, ignoring steep losses
Financial Metrics Analysis
Chart 1: AI Industry Valuations vs Revenue
Company          | Valuation (B) | Revenue (B) | Valuation/Revenue Ratio
-----------------|---------------|-------------|----------------------
OpenAI           | 822           | 13          | 63.2
Anthropic        | 965           | 40          | 24.1
xAI              | 250           | 3.2         | 78.1
Hyperscalers     | ~12T          | ~1.5T       | 8.0
(MSFT, AMZN, GOOG)
AI Labs (Total)  | 2,500         | 56          | 44.6
Productivity and Return on Investment Challenges
The Solow Paradox in AI
The report draws parallels between current AI development and the famous “Solow Productivity Paradox” from the 1990s:
- Computer Revolution: From 1955 to 1979, productivity increased at 0.8% annually
- Computer Era: From 1980 to 1997, productivity actually declined to 0.45% annually
- AI Era: Despite massive investments, productivity gains remain minimal
Real-World Implementation Costs
Chart 2: AI Implementation Cost Analysis
Cost Factor                     | Typical Increase in Costs
--------------------------------|--------------------------
AI Infrastructure Spending      | 100-1000% over traditional methods
Error Correction & Rework       | 50-300% additional costs
Staff Training & Adaptation     | 20-50% of initial investment
System Integration              | 30-80% of project budget
Key findings:
- 95% of organizations report zero return on GenAI investments
- 71% of companies have little to no control over AI costs
- 84% of companies see 6%+ gross margin erosion due to AI infrastructure costs
- Companies miss AI forecasted costs by more than 25% in most cases
Case Studies in AI Failure
- Uber’s AI Budget: Burned through annual AI budget in just four months
- Microsoft’s Claude Code: Cut access after six months despite initial deployment
- Nvidia’s GPU Costs: Compute costs far exceed employee costs for AI teams
- Database Destruction: AI agents have destroyed company databases with catastrophic results
Systemic Financial Risks
The Debt Bubble Structure
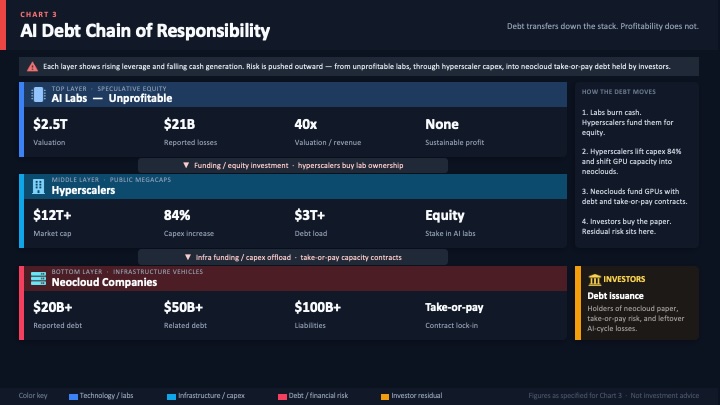
The AI debt bubble operates through several interconnected layers:
Chart 3: AI Debt Chain of Responsibility
AI Labs (Unprofitable) → Hyperscalers → Neocloud Companies → Investors
     ↓                        ↓                    ↓
   $2.5T val               $12T cap              $20B+ debt
   $21B losses            $3T+ market cap       $100B+ liabilities
   40x revenue ratio      84% capex increase    $50B+ in debt
Insurance Company Exposure
Life insurance companies are particularly vulnerable to AI debt risks:
- Total Assets: $11.0 trillion in assets and $10.6 trillion in liabilities
- Equity Cushion: Only 4% equity cushion (extremely low)
- Private Credit Holdings: 42% of the entire private credit market
- PE-Insurer Links: 7% of the $11 trillion industry is controlled by PE firms
Banking and Financial System Impact
Chart 4: Financial System Exposure
Component                | Exposure Level       | Risk Factor
-------------------------|----------------------|------------
Margin Loans             | $600B+              | High
Policy Loans             | $152B+              | Medium
Retirement Account Holdings | 29.7% S&P500     | Critical
Banking System           | All major banks     | High
Market Dynamics and Valuation Discrepancies
Comparison with Historical Bubbles
Chart 5: Bubble Comparisons
Bubble Type              | Peak Valuation | Duration | Collapse Risk
-------------------------|----------------|----------|---------------
AI Bubble                | $2.5T AI Labs  | 3-5 years| Very High
Internet Bubble          | $1.2T Tech     | 2-3 years| Moderate
Housing Bubble           | $6T Housing    | 4-6 years| High
Railroad Bubble          | $100B+         | 10+ years| Low
Market Capitalization Trends
Chart 6: AI Sector Growth vs Reality
Year | AI Sector Cap (B) | Real GDP % | Productivity Impact
-----|-------------------|------------|-------------------
2022 | $100              | 2.4%       | Minimal
2023 | $350              | 2.4%       | Minimal
2024 | $800              | 2.4%       | Minimal
2025 | $1,500            | 2.4%       | Minimal
2026 | $2,500            | 2.4%       | Minimal
Implications for AI Startups
Funding Challenges
Startups face several critical issues:
- Capital Efficiency: Most AI startups are burning through funds without generating returns
- Market Saturation: Over 100 neocloud companies have entered the market, driving pricing down to marginal costs
- Debt Sustainability: The take-or-pay contracts for infrastructure have durations of 5-7 years but will face obsolescence
Business Model Viability
Chart 7: Startup Valuation vs Reality
Startup Type          | Valuation (B) | Revenue (B) | Margin
----------------------|---------------|-------------|--------
AI Infrastructure     | 100+          | 1-5         | -80% to -90%
AI Software Solutions | 200+          | 5-10        | -70% to -80%
AI Services           | 50+           | 2-5         | -60% to -70%
Traditional AI Labs   | 1000+         | 10-20       | -50% to -60%
Recommendations for Businesses
Risk Assessment Framework
Businesses should consider the following factors:
- Productivity Impact: Current evidence shows minimal productivity gains
- Cost Management: Implement strict budget controls and ROI monitoring
- Implementation Strategy: Focus on specific, measurable use cases rather than broad deployment
- Financial Planning: Prepare for potential losses and adjust business models accordingly
Strategic Considerations
- Selective Investment: Only invest in AI applications with clear ROI metrics
- Gradual Implementation: Avoid massive upfront investments without proven results
- Alternative Technologies: Consider traditional automation and process optimization before AI
- Diversification: Don’t concentrate all AI investment in a single approach or vendor
Conclusion
The AI debt phenomenon represents a significant financial risk to both individual businesses and the broader financial system. While AI technology holds promise, current valuations and business cases are based on unrealistic expectations of productivity gains and return on investment.
Key takeaways:
- The AI industry is experiencing a bubble similar to historical market bubbles
- Productivity gains from AI are far below projections
- Financial risks are systemic and could threaten banking stability
- Insurance companies face particular vulnerability to AI debt exposure
- Startups should proceed with extreme caution in their AI investments
The financial system’s stability depends on addressing these issues before they escalate into a full-scale crisis, similar to what occurred during previous financial bubbles. Businesses and investors must carefully evaluate the true value proposition of AI investments rather than being swept up in market enthusiasm.
References
- Myrmikan Research, “AI Debt Failure Will Prompt Another Wave of Fed Bailouts,” August 14, 2026
- MIT NANDA, “The GenAI Divide,” July 2025
- IDC Research, “Insight from early enterprise deployments,” November 2025
- McKinsey & Company, “Beyond $1 trillion: The next chapter for insurance and private capital,” April 2026
- Federal Reserve Bank of Chicago, “Life Insurers’ Private Credit Investments,” April 2026


